
| Introduction |
| Configuration |
| Framework |
| Tutorial and tests |
| Download |
| Dynamical
System |
states equations
To create a model framework, use the menu Edit->Dynamical System. The following window appears:

The 2 first fields reprensent the bounds of th interval of simulation and the 2 last fields are the min and max time step to make computation.
The user can define the state name of the nodes and edges by filling in the name in the line edit Nodes State Name or Edges State Name and clicking on the button Add. To delete a state name select it in the list box and click on the corresponding Del button. To define the state functions, click on the corresponding button. The following window appears:
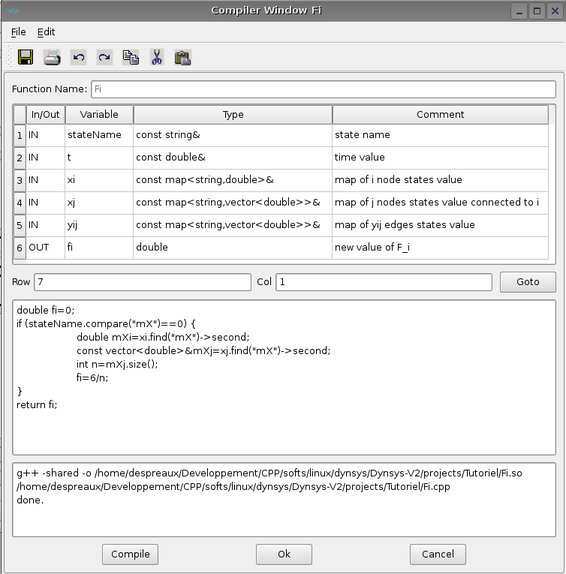
Available variables are listed in the panel:
- the stateName variable is the name of the state to compute.
- t variable is the time value of computation
- xi variable is the state value of the node i in which the state name are computed. User has to specify the state variable in that way double mXi=xi.find("mX")
- xj variable is a vector of state values corresponding to nodes j connected to node i. Its size is the number of connections of the node i.
- yij variable is a vector of state values of the edges connected to node i and j. Its size is exactly the same of the size of xj.
- fi is the computed state value stateName variable of node i.
The body of the function must be written in C++ language. To compile it, click on the Compile button. It use the compile command provided in preferences window. To close the window click on the Ok button, to cancel the function click on the button.
To provide the edge state function click on the corresponding button and the new window (on the same model of nodes state function) appears:

Available variables are listed in the panel in order to specify the dynamic of the edge [i,j]:
- the stateName is the name of the state to compute.
- t is the time value of computation
- xi is the state value of the node i
- xj is the state value of the node j
- yij is the state value of the edge [i,j] i and j. Its size is exactly the same of the size of xj.
- gij is the computed state value stateName variable of edge [i,j]
The body of the function must be written in C++ language. To compile it, click on the Compile button. It use the compile command provided in preferences window. To close the window click on the Ok button, to cancel the function click on the button.
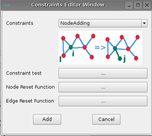
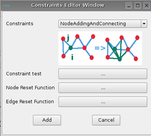
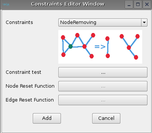
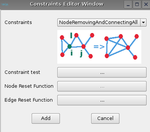
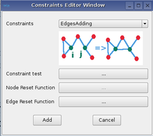
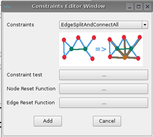
Once the states equations are entered, the user has to define the graph transformation. The different rules are:
 |
 |
 |
||
 |
 |
 |
||
 |
 |
 |
||
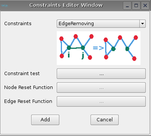 |
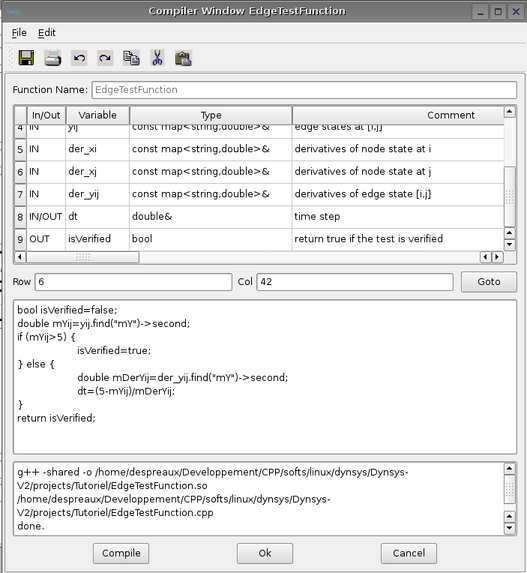
For each rules, a constraint, reset node and edge must be defined in agreement with the rule.
For example for the constraint of an edge fusionning, we have 9 variables:
t is the time value of the iteration
xi is the i node states of the edge [i,j]
xj is the j node states of the edge [i,j]
yij is the edge states of the edge [i,j]
der_xi, der_xj,der_yij are the derivatives values of the states
dt is the new computed time step for the prediction time where the constraint test seems to be verified (linear approach)
isVerified is the return value which has to be true if the test is verified, false otherwise.
The aim of this prediction is to capture all the graph transformation.
For this rule, a node reset function has to be provided:
This function has 5 variables:
xi the state values of node i of edge [i,j]
xj the state values of node j of edge [i,j] (the node j will disappear, so xj can not be modified)
xil the state values of node l where l is connected to i but not to j
xjp the state values of node p where p is connected to j but not to i
xijc the state values of node c where c is connected to i and j

For this rule an edge reset function has to be provided:
This function has 6 variables:
yij the state values of edge [i,j] (ReadOnly - the edge will disappear)
yil the state values of edge [i,l] where l is only connected to i
yjp the state values of edge [j,p] where p is only connected to j (ReadOnly - the edge will disappear)
yip the state values of edge [i,p] where p is only connected to j (Edge will appear)
yic the state values of edge [i,c] where c is connected to i and j
yjc the state values of edge [i,c] where c is connected to i and j ReadOnly - the edge will disappear)
Then to Add the rule, click on the Add button.
To edit / Delete the constraint, click on the Edit/ Del button of the dynamical system window.
When many constraints are added, the order of the constraints are primordial. That's why it is possible to modify the priority of the constraint by clicking on +/- buttons. The position of the rule in the list determine its order of priority.
It is possible to use the global node or edge states initialisation instead of local initiatialisation by selecting the components of .
Don't forget to save the dynamical system in order not to lose your job !
Adjacency Matrix
The initial graph of the dynamical system is set thanks to the menu Edit->Graph Nodes Connection.
The graph nodes connections appears:
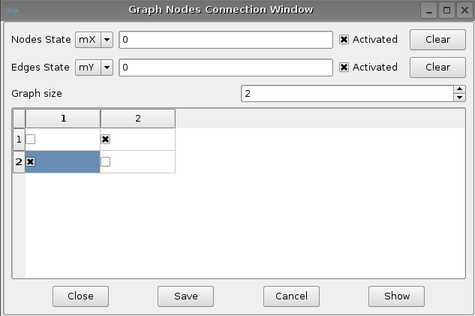
To set the dimension of the initial graph, put the right value in the spin box Graph size; To add a connection between node i and j click on the matrix check box. As the edge are unoriented, the matrix is symetric.
To init all the nodes or edges states values , click on activated check box. If not see the graph by clicking on show and the graph window appears:

Double click on node or edge to obtain the corresponding window:
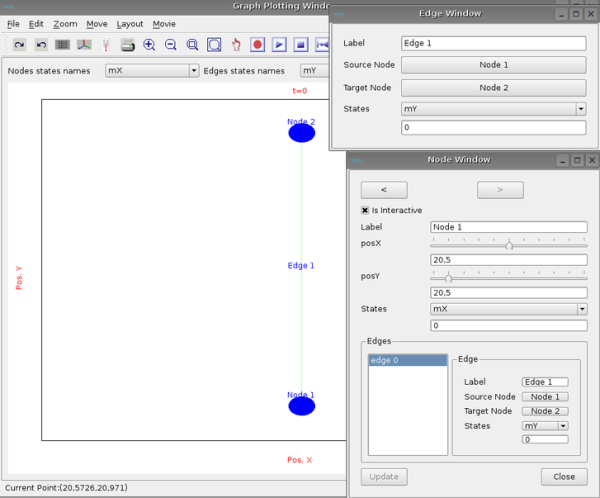
All the properties of the node or edge can be changed thanks to those windows.
Notice that at the beginning the position of the nodes in the graph are not computed. There is 2 ways to compute the position of nodes:
- either use the layout of graph thanks to menu layout in the graph window. 4 layouts are available an empty, an hierarchic, an orthogonal layout and an energy based layout. Empty do nothing place the nodes as youuu want thanks to the node position cursor in node window, the hierarchy layout try to display the nodes in a hierarchic way, the same thing is done concerning the orthogonal layout. the energy based layout tried to minimized a criterium function.Other layouts will be implemented in a next future.
- or use 2 particular states: mPosX and mPosY and define the dynamic equations of those 2 states.
To simulate the evolution of the dynamical system, click on the menu Simulation->Run. The system will interactivly evoluate on the screen. It is possible to stop the simulation by clicking on the Cancel button of the progress window.
The graph evolution appears on the window; It is possible to browse the files thanks to the movie button on the right corner of the tool bar of the graph plotting window:

To zoom in click on the icon +, to zoom out, on the button - , to move on the window click on the drawing area and move the mouse. to select a region , unselect the hand icon and select the zoom square icon then select an are by a red rectangle. Many options are available.
It is possible to record all the images in one movie file by clicking on the record button (red point) or Movie->record. In order to work, you have to have mencoder installed on your computer and to put its path in the corresponding line edit in preferences panel. To play it, use the command on linux: "mplayer -vo x11 Movie/movie.avi".
Analysis
Some tools are available to make analysis on graph. Eigen values of the graph may be computed. Other tools will be implemented in a next future.