The particles network is a grid of size 10 x 10 x 1 whith a space step size is \(h_0=h_1=h_2=1 \)
A particle P is linked to all particules Q of the network if \( Q \in V_P=\{\displaystyle M_{{ax}_k}(|P_x-Q_x|)<=h_k \} \).
The Heissenberg coeficient of all particles is set to \(J=0 \). Note that if \(J \neq 0 \) the Heissenberg coefficient of the particle P is \( J_{pp}= - \displaystyle \sum_{q \in V_P} J_{pq} \).
The stochastic function is the Îto model modelized by the boost normal law and with a noise rate \( \varepsilon = 0 \) for determinitic case.
The options are set in the options file.
The simulation is computed by the code
The code generates 4 file's types within the output path :
- the log file to print all the comments, warnings, errors and provided options .
- the prefix-meanE.txt text file describes the mean of the total energy at each time : t \( \bar E(t) \) is at each line
- for each trajectory computed (given by the array option simulations), it gives:
- prefix-Es-si.txt text file which describes the evolution of all the energies at each time : t \( E_{tot}\) \( E_{z}\) \( E_{dem} \) \( E_{h} \)
- prefix-mu-si.txt text file which describes the magnetic moment for the si-th simulation at each time : t \( \forall p \in [0,P[, \forall k \in [0,2], \mu^p_k(t) \) at each line. It means 3xP+1 values per line where P is the number of particles
- prefix-mu-si.xmf which describes the same file as above but for the paraview program. With paraview software use:
- XDMF reader
- add the glyph filter
- add the annotateTimeFilter1 with dt in scale parameter
- and click on the play animation button and set the options (framerate, max number of iterations...)
- to save go to File->save animation to save the film or File-> save screenshot to save image
To plot the energies txt file use the gnuplot script :
The obtained results are as follow:
aa href="../examples/Grid10x10x1/Doc/Es.png"> 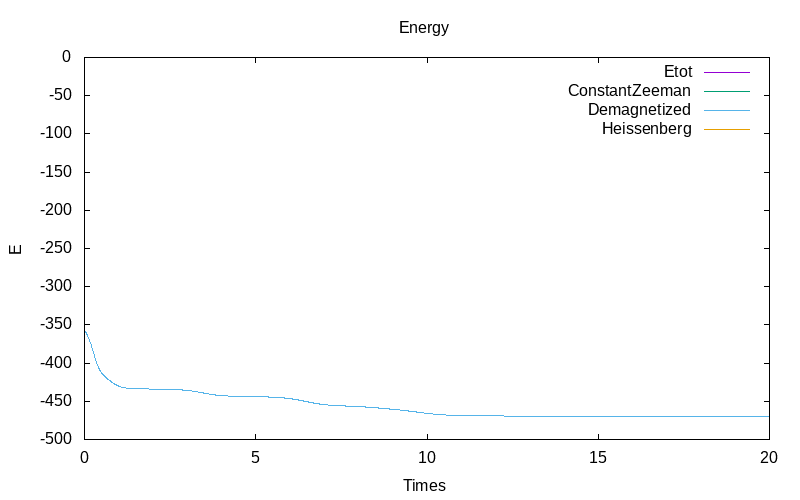 > > |
 |
| the energy evolution | the magnetic momenet evolution |